интересный сайт с точки зрения возможного обьяснения цикличности событий
KONDRATIEFF AND SOLAR CYCLES
Kondratieff was a Russian economist who argued that there was a long sine wave cycle in the economy lasting around 60 years broken down into 4 seasons each lasting around 15 years. There proposed reason for the cycle is…. other cycles. In other words, cycles of demographics, credit cycles, capital investment cycles and more, generate these long repetitions over time. Clearly that’s slightly unsatisfactory, unless we can explain the cycles of the source phenomena. Today, I am going to argue that Kondratieff cycling actually reflects solar cycling.
Here is the Kondratieff cycle and its subseasons:
Source: The Long Wave Analyst
We should be in a K-winter since around 2000, with gold and treasuries king. With both gold and treasuries having performed handsomely over the last decade and recently reached all time nominal highs, evidence is supportive.
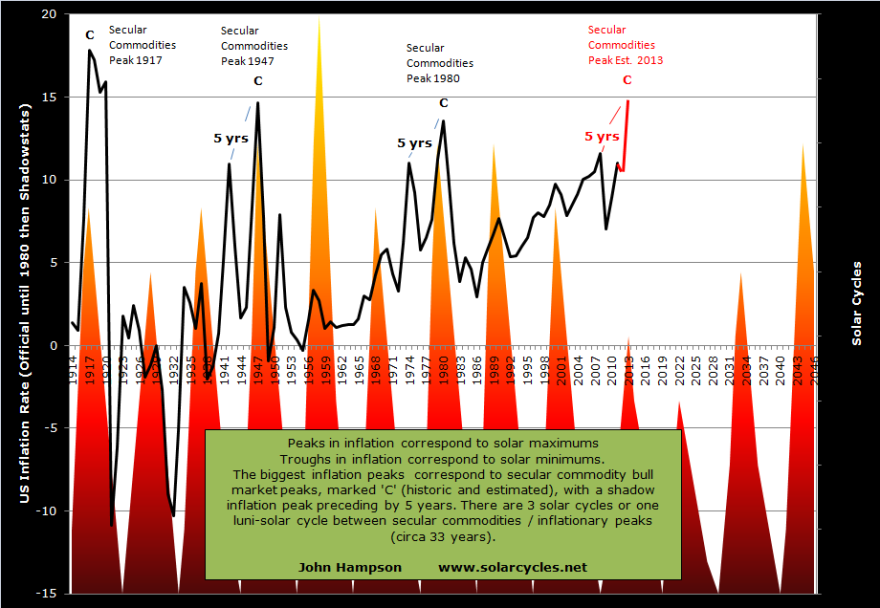
The general theme of the K-winter should be deflation and cleansing. When Kondratieff wrote his theory, central banks did not have the freedom they have now to counter-attack with intervention and monetary inflation. Using Shadowstats data, we can see that the results of their actions in the US: high price inflation rather than deflation.
Source: Dshort
However, when US GDP is netted of this inflation, we can see that the K-winter appears to have fulfilled: a period of shrinkage, or cleansing.
Source: Dshort
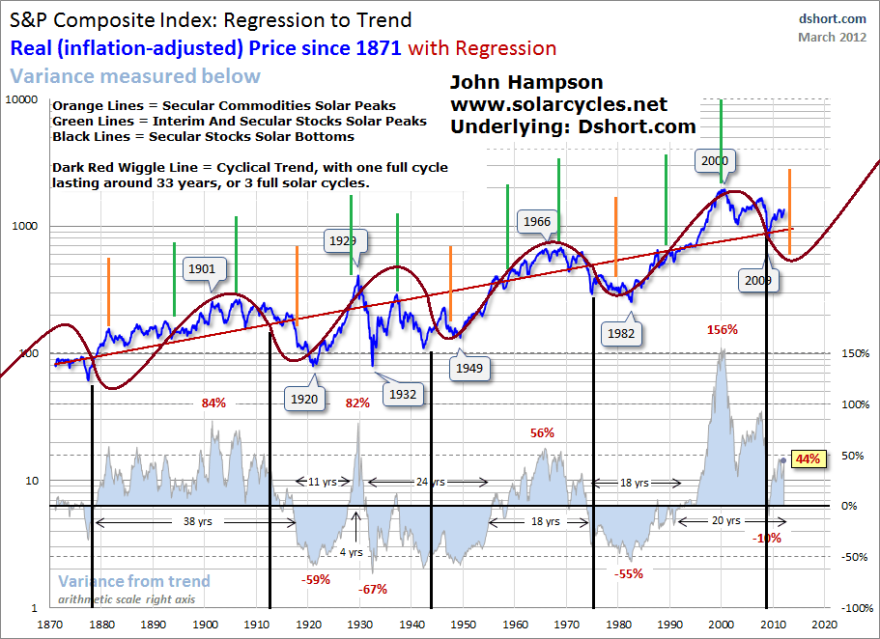
We can measure this another way: stocks have tracked overall sideways since 2000 but when adjusted for inflation have significantly dropped. This is reflected in price/earnings ratios gradually falling since 2000 by more than half.
There has been a lot of debate about which of the two ‘flations is and has been occurring over this last decade, and it’s understandable. There has been major monetary inflation, and this has resulted in significant price inflation particularly in hard assets such as commodities. Yet, there have been characteristics of deflation: real economy shrinkage, a decline in money velocity (cash hoarding), debt deflation (in households and companies), and liquidity traps.
I suggest that some kind of K-winter has indeed been playing out since 2000 as per the theory, and that governments have been unable to prevent that, but they have been able to prevent a social-conflict-inducing depression by tinkering in the economy with what they can (rate cuts, bailouts, money supply increase, balance sheet expansion). The result is two-fold: (i) in nominal terms the economy and asset prices have held up because inflation has offset real declines (a popular illusion) and (ii) a lighter rather than deeper cleansing has been possible in the economy and assets because public balance sheets have been expanded to simply transfer some of the previous excesses rather than purging them. There is no magic to the public balance sheet expansion: this is simply prosperity taken from the future.
So, central bank large-scale intervention in a ‘natural’ period of cleansing (following the excesses of the 1980s and 1990s) has changed the parameters understood by Kondratieff. The result of pushing easy money onto an economy in cleansing is a series of speculative bubbles from real estate to oil to agriculture to bonds to precious metals to equities. Over the last decade we have seen them take turns in making parabolic rises. Be aware though that much of this action is in nominal terms, i.e. net of inflation the gains are much less impressive. Nevertheless, if Kondratieff theory is valid, then our current K-winter is as much dominated by assets that perform well under inflation, such as commodities, equities and real estate, as dominated by gold and bonds as safe havens.
What if there is a K-winter finale ahead, in which outright deflation reasserts itself and just gold and bonds rise (perhaps in a parabolic)? Those who advocate that we are tumbling into recession currently and that this will reveal central banks to be powerless (given rates at zero and stimulus back on) could perhaps buy into that scenario. Let’s compare the last K-winter and see if this happened.
The last K-winter was the late 1930s and the 1940s. As now, equities were in a secular bear market, economies were in trouble following the excesses of the preceding decades. The world war pushed debt to high levels and so governments had to keep rates low. Inflation was problematic accordingly, and we saw a similar inflation/deflation mix to the current K-winter, in that economies shrank but assets such as commodities performed well due to easy conditions. The K-winter did not draw to a close with a deflationary assertion and a huge money flow into just bonds/precious metals and out of pro-risk, but rather a general commodities peak and associated inflation peak in 1947, followed by a gentle coiling of equities and then true secular equities bull momentum as of 1949.
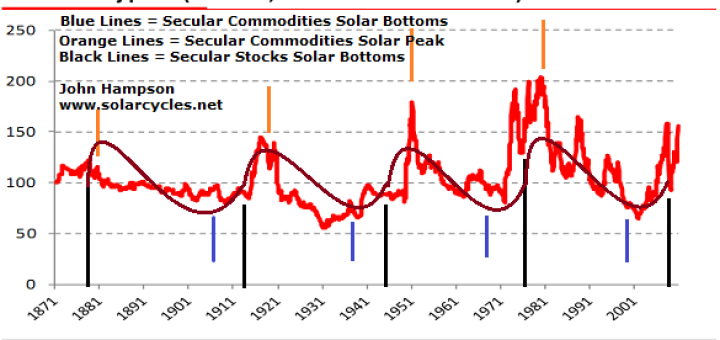
I have maintained that the 1940s is our closest mirror to our current period since 2000, due to the secular commodities bull and secular stocks bear, the combination of ultra low rates and problematic inflation, and by solar cycle timing. The Kondratieff cycle would calculate this too, as it was the last comparable K Winter season. So let me now draw together solar/secular cycling and Kondratieff cycling (click to enlarge):
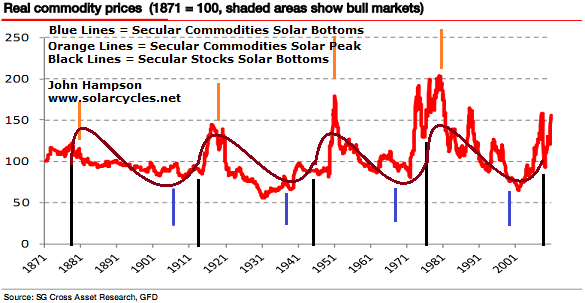
This diagram is an idealised cycles model, all based around solar. In my previous work I have demonstrated that solar peaks occur roughly every 11 years and that secular peaks in equities and commodities occur close to solar peaks. There is a sine wave in long term real stocks and an opposite-polarity sine wave in long term real commodities, both which have around a 33 year (equivalent to 3 solar cycles or 1 lunisolar cycle) duration, as shown in the charts below. Treasuries (or inverse rates/yields) move in around a 66 year cycle (2 lunisolar cycles) with peaks and troughs converging with secular commodities peaks. The result is we see two different kinds of secular commodities bulls: one set against rates moving to a peak, and one set against rates moving to nothing.
I believe that idealised combined cycles model fits very well with Kondratieff theory. The only adjustments I have made were to slightly shorten the summer and winter seasons by slightly extending the spring and autumn seasons, which doesn’t stray too far from his time ranges for the seasons. The combined model does suggest that there are differences between our current period and the 1970s or 1910s, which were both previous secular commodities bulls and secular stocks bears. They were K-summers where inflation was the only ‘flation in town, whereas today’s K-winter and the 1940s K-winter both had elements of inflation and deflation: a natural deflationary cycle offset by inflationary central bank actions. Regardless, the K-summers and K-winters ended in a similar way: with an inflationary peak and a general commodities peak, and a range-trading for equities.
Picture the current K-winter without central bank intervention. A deflationary depression would likely have occurred. Unemployment and defaults would have been much more severe, cleansing much deeper. Social conflict would likely have been much greater. But the natural process of cleansing would have given way to a new cycle of growth ahead in the same way with or without intervention. What the intervention has done is make the K-winter process less severe all round by some can-kicking (a lot of the ‘bad’ has been absorbed into new public debt, which will have to be paid for at some point, but not now). By keeping rates ultra low and bailing out companies and countries that could have had much wider impacts we are moving towards that new K-spring and cycle of growth with a significant helping hand (putting future generation implications aside).
I suggest that Kondratieff found evidence of cycles that were actually approximations of solar cycles. In other words, he uncovered repetitions in time in the economy and financial markets that ultimately are caused by the sun’s cycle of activity and its influence on humans. The long term sine wave to which he refers is apparent on my charts above for real equities and real commodities due to the speculative pulls into the solar peaks, and there is a similar relation with treasuries/rates. The idealised model that I have produced shows that the relations between these 3 asset classes and solar peaks produces one 66-year cycle within which there are 4 different periods, as the different assets are pulled to the solar peaks with different frequencies and alternations. These four periods fit very well with Kondratieff’s seasons by their characteristics, and the whole cycle likewise. I believe that a few tweaks are needed to K-theory to make it more accurate: the two shorter and two longer seasons per my model, and the K-winter now featuring central bank intervention and a mix of inflationary characteristics as well as deflationary (with associated implications for hard assets).


Последние комментарии